
At The End Of One: 2025 FBS Kicker Rankings Through 3 Weeks
- Justin Stombler
- Sep 18, 2025
- 5 min read
Football is a game of quarters and as we finish the first 15 minutes of the 2025 FBS season there are many unanswered questions. Who's good? Who's bad? And most importantly, who will think of the kickers?
There remains much football to be played but let's get a meter reading on the kicking landscape so far.
Luckily for me, the first 3 weeks of the season have provided plenty of data, and so I present an earlier-than-usual First Quarter edition of the FBS Kicker Value Added Ranking.
Value Added?
In short, my rankings are based on a given kicker's Total Added Value, which has a pretty simple calculation.
Actual Value = FGM * Actual Point Value of Kick
Expected Value = FGA * Expected Point Value of Kick
Added Value = Actual Value - Expected Value
Let's run through a short example to show this in practice, considering Cincinnati kicker Nathan Hawks' 2024 season. On the surface, Hawks went a respectable 13/17 on the year, but what about his added value?

1.78 points of Added Value for Hawks, which placed him at 57th out of the 134 FBS kickers in the 2024 rankings. While he was able to amass value both up close and at range, the middle distances were more of a struggle for him. Nevertheless, an above average kicker and an above average season.
This is the methodology behind the rankings below. Now that we've set the stage, let's see who's playing the part.
The Numbers
Through 3 weeks there have been 484 successful field goals on 625 attempts across the FBS, good for a 77% conversion rate.
How has that played out across distance? About as you'd expect; accuracy tends to dip as attempts get longer.

A blocked 19-yard attempt from ECU's Nick Mazzie is the only miss from under 20 to start the season, while Iowa State's Kyle Konrardy's 63-yard make is the only successful kick from beyond 60.
The large drop in accuracy between 40-44 and 45-49 is unexpected over the course of a full season, and I would bet that this graph changes to look a bit more like the traditional decrease over distance we've seen in previous seasons. As group accuracy changes, so will the value of attempted kicks in retrospect, leading to potentially large shifts over the course of the season.
What does this mean for the rankings? While we wait for the data to accumulate, kicks from between 45-55 yards are currently potentially overvalued. In the 2024 season, accuracy on both 45-49 and 50-54 were about 10 percentage points higher than on the graph above.
Anyway. Enough chatting, let's get into it.
First Quarter FBS Kicker Rankings
Here are your 2025 first quarter Value Added Kicker Rankings.

The Good

After the first 3 weeks, it is Hawai'i kicker Kansei Matsuzawa (who became known for having learned the place-kicking craft on YouTube while living in Japan) with a commanding lead, having amassed over 6.5 points of added value, more than 1.5 points above second place Jackson Kleather out of Bowling Green.
Matsuzawa has been in amazing form so far, perfect on 11 attempts with an average distance of 37.8 yards. While it is worth noting that Hawai'i has already played 4 games to most teams' 3, it's hard to understate how good he has been to start the season. As seen below, Kleather has put up a good fight so far.

Kleather's prolificness from all ranges has afforded him second in our rankings even with a miss. At this stage in the season that is incredibly rare. In fact, no one else in the top 10 at this stage has missed a single kick.
California's Abram Murray and Western Kentucky's John Cannon also stand out. Despite both only going 4/4 to start the year, their average distances of 45.5 and 45.0 yards adds a lot of value to their performance and as such they're slotted into a tie for 5th with just over 4 points of added value.

The distance effect can be seen elsewhere as well. Houston's Ethan Sanchez has missed 3 kicks already, starting the season 7 for 10. However, with his average distance of 45.6 yards the misses can only hurt so much, and the makes speak for themselves. Sanchez is the only kicker with a positive Added Value to have missed so many kicks.
This effect is best illustrated when comparing Sanchez's performance with Arizona's Michael Salgado-Medina, who has also gone 7 for 10, but with an average distance of 40.8 yards and a majority of his makes coming from 30-35.

The Bad
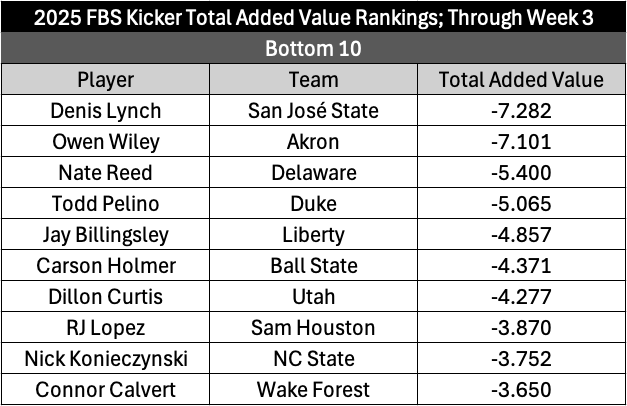
Firstly, an unfortunate shoutout to San José State's Denis Lynch, the only kicker in the rankings to have not made a field goal on multiple attempts. His -7.28 Added Value is the lowest at this point in the season.
Not far in front is Akron's Owen Wiley, who has gone 2 for 6 in his own path to -7.1 Added Value. Both Lynch and Wiley are the clear bottom through 3 weeks. It is worth noting that each of them have had 3 attempts of longer than 45 yards, all misses. At some point, you'd expect a coach to keep the offense on the field.

You're probably sick of hearing it, but to stand out from the other fantastic kickers of the FBS it isn't enough to make kicks at a good clip; they HAVE to be from an area of the field that returns more value (further away). This is epitomized in what I'm referring to as The Unfortunate Case of Bettridge and McFadden.
Both UVA's Will Bettridge and Nevada's McFadden are 7/9 on the season, which independent of distance is certainly quite good, and would be expected to land them in the top third of the Added Value rankings. However, only 2 of their combined 14 makes have been from 40+, meaning that their 2 misses have effectively outweighed their 7 makes. Bettridge sits 100th in the rankings, while McFadden is 109th, each with solidly negative Added Value.

The most extreme example of this is actually Missouri's Robert Meyer, who is 3/4 on the year but with an average distance of merely 27 yards per attempt. His 3 makes, from 20, 22, and 25 don't do much against his miss from 41, as he has worse than -2 points of Added Value, and sits 113th on the list.

Laces Out: Interesting Tidbits
By this point, it's so obscenely obvious that the way to a higher added value is to both make your kicks and be given more opportunities from longer range. Would it then still stand to reason that there would exist a positive correlation between average distance of attempt and a kicker's Added Value? As it turns out, nope.

Despite the above, this seems easily explainable. Difficulty of the kick increases in part with distance, so while more Added Value is up for grabs there's less assurance that it'll be taken. I still find it very interesting how utterly devoid of any correlation there seems to be here, and want to see how that changes over the season. Also, some of these teams need to really reign in their understanding of their kicker's range.
The lack of correlation also exists so far when comparing total attempts (FGA) with a kicker's Added Value. I would expect this to change as the season goes along, as kickers who continue to prove themselves trustworthy will get more opportunities throughout the season than those who don't as coaches adapt to their strengths and weaknesses.

It will be interesting to see how things change as the season progresses. Over the next 3 weeks we'll see more pressure-packed moment, more seemingly inconsequential kicks, and everything in between.
In the meantime that's all for now. See you at the halftime show!
If you liked this article, give me a follow on Twitter at @SevenYardsBack. Thanks!


I liked how the rankings focused on details that many casual fans usually overlook in football. During one packed semester, I followed sports updates while using Sophia learning course completion service to keep up with deadlines. Sports analysis becomes more interesting when writers explain performances with clear observations and passion for the game.
The rankings discussion for kickers was detailed and shows how performance analysis changes over time. I once followed sports stats during a tournament and got surprisingly invested in small performance differences. It’s interesting that students sometimes search online class services when they feel overloaded, which reflects time pressure. The post made me realize how data-driven thinking applies in many areas of life.
Reading your post aboutKicker rankings show how skilled college football players need to be. I grew up watching games while trying to keep up with school tasks. At one point I even had take my online PhD exam help while watching matches so I would not miss the action. It shows how intense both sports and studies can get. A clear plan helps a lot for big test days. human-centered storytelling. reminds me of the intense research sessions. Nice post, it make me smile.